
Tomorrow is historically the worst day of the year for U.S. stocks. Here’s why
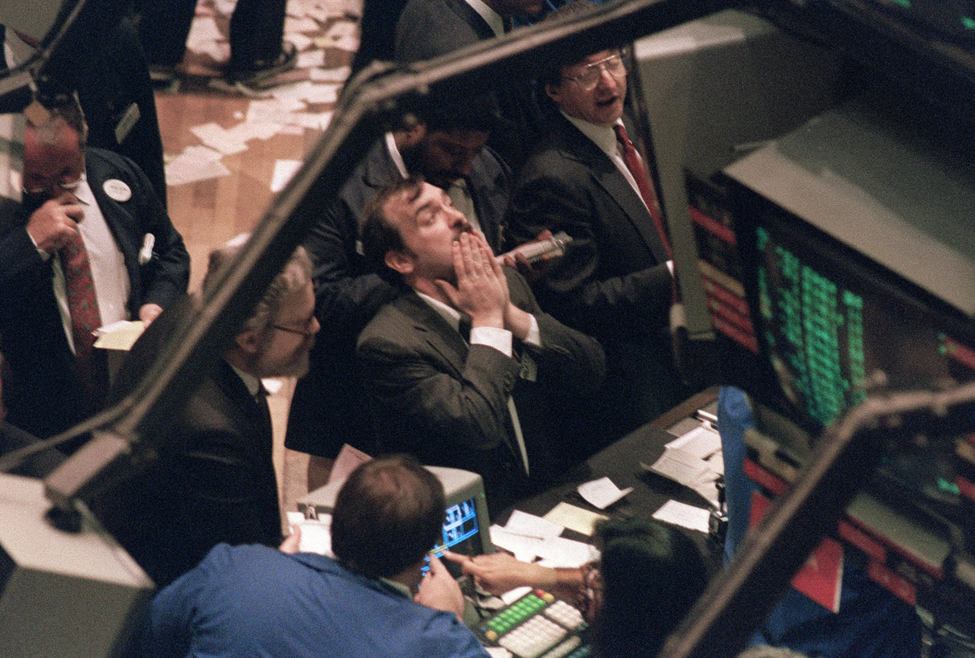
Black Monday historical photo
I could file this as ‘junk’ rather than ‘tradeable’, but the worst day to own a stock since 1950 is October 19th. According to Carson Investment Research, the average decline over those 72 years is -0.51%.
From where?
When you look at this chart, the 19th-20th tends to show general softness, which may reflect some sort of monthly pattern of stock market flows in general.
But more broadly, it reflects a single day when stocks were crushed: black monday It was October 19, 1987. The index fell by 20.47% that day.
Two other sales on October 19 also stand out:
- On October 19, 2007, the index fell by 2.56% as concerns about the US housing market began to increase during this period.
- On October 19, 2018, the index fell nearly 1% as part of a larger decline in October that resulted in a 7.3% decline, the worst October since the financial crisis. At the time, the market was concerned about valuation, interest rate hikes and trade tensions with China.
Overall, the lesson here is probably ‘beware of averages’ rather than ‘be careful on October 19’. Here is the latest transaction history for October 19:
The conditions are in place for another brutal day for equity markets, especially if bond yields continue to rise.